Classic Network Design Case Study With a Twist for Air Shipments

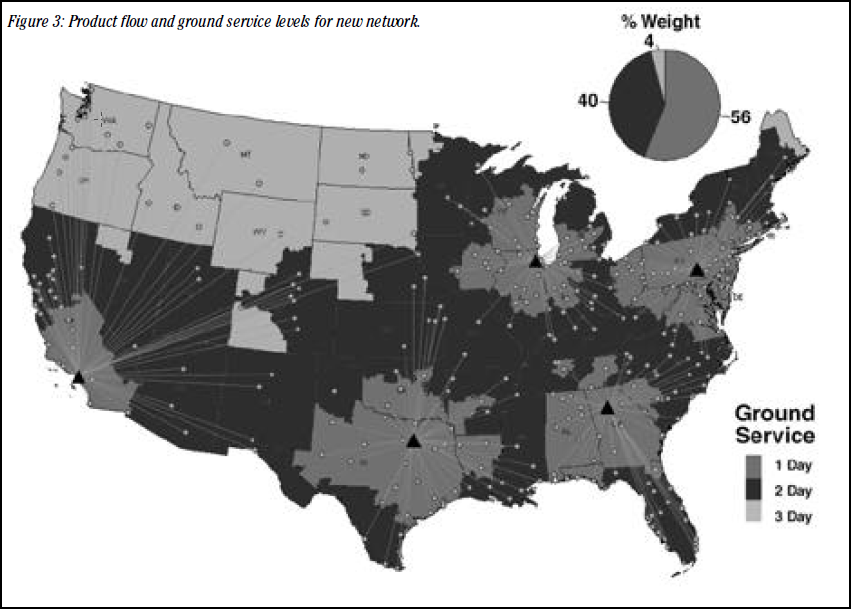
When locating a warehouse, there is usually a trade-off between the number of warehouses and service level.  That is, as you add more warehouses, are you are closer to your customers.

However, if you can ship your product via air (like with UPS), there is a twist to this trade-off.  You have the choice to pay for much more expensive air services, but you can avoid the extra cost of warehouses and inventory.  For light, high-value items, it may make perfect sense to ship via air services.

I was able to publish a nice case study on this with Jim Morton (then of UPS).  Click here for the article.

Cost-To-Serve Modeling and Network Design

Earlier this week, I published an article on cost-to-serve on SupplyChainDigest.

Network design plays a nice role in cost-to-serve modeling:

Network design modeling software can complete the analysis by allocating those cost that simply cannot be allocated with Excel.  For example, it is not trivial to allocate your inbound transportation costs or costs of raw materials to your customers.  When using your network modeling software for this, you may want to model every customer and every product, but limit the amount of optimization (you don’t want to consider opening and closing facilities with this use of the tool.).  Then, when you run, the tool returns details on the cost to get each product to each customer.  In effect, this tool allocates all your transportation costs, your production costs, and your warehousing costs to a customer and product combination.  You get all this information as part of a standard network optimization run—it requires no special features.

This is another good reason to have the capability to run a network modeling tool.

Plant Location in a Global Economy

The Economist recently published an survey on Offshoring and Outsourcing.  If you follow manufacturing trends, this article is great read.

The survey covers trends in both manufacturing and services.  It goes in-depth into the manufacturing trend we are now seeing with many companies bringing manufacturing back to the US or to the market where the demand is.

The survey highlights the fact that companies are discovering the “all the disadvantages of distance.”  This includes the high transportation costs along with the extra risks.  But, it also points out that the wage gap is shrinking between China and the US, natural gas is driving down energy costs, and automation is removing a lot of labor anyway.

The article quotes one consultant who claims that if total labor costs are less than 15% of the product’s cost, then it is not worth it to pursue cheap labor.

Also, there was a nice quote that reminds us of the value and limitations of network design:

Choosing the right location for producing a good or a service is an inexact science, and many companies got it wrong.

They are correct, that network design is not an exact science, but using network design tools can help you better narrow your choices and pick good solutions.  With network design, you have a better chance of getting it right.  And, if you continually model your supply chain, you can better adjust as conditions change.

Some Basics of Modeling Multiple Time Periods

Adding extra time periods to a network design model turns out to be a bit harder than it would seem.

First, since network design is a computationally hard problem, when we create a 12 time period model, the size grows by 12X, but run time could easily increase by 100X.  So, keep that in mind as you add multiple time periods.

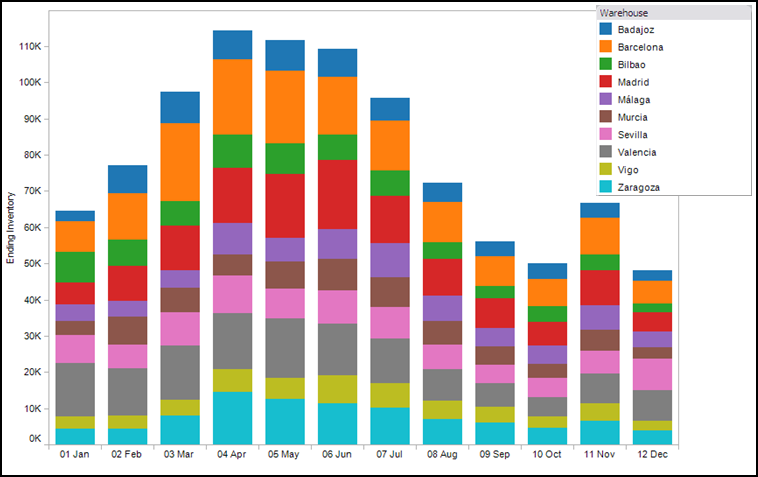
Second, you need to think harder about how the model works.  One key idea is to think about what links the time periods together.  In a model with multiple years (say an annual model for the next 10 years), the locations link one time period to the next.  That is, if you open a new plant in Year 2, it will be there in Year 3 unless you close it.  In a model with multiple weeks or months, the locations still link the time periods.  But, inventory also links the time periods.  So, I can build extra inventory in March that will be used to satisfy demand in July (the graph at the top is showing this inventory build).

Finally, you need to think about the data.  There is nothing unique about a multi-year model.  But, with a monthly model, you need to think about the starting inventory (there is product in the system at time period 0) and the ending inventory (you don’t want the model to drain all the inventory from the system in the last time periods).  Collecting data on starting and ending inventory can be problematic.  If you can do it, it is sometimes helpful to start your model at the very end of the season when inventory is at its lowest.  This can prevent some of the data issues.

Importance of Single Sourcing Groups of Customers


In practice, you need flexibility to single source customers and groups of customers.  (By customers, I am referring to the final ship-to location.  This could be a retail store, your distributor’s warehouse, or even an end consumer)

For example, you many minimize your costs by shipping from multiple warehouses or plants to a customer.  But, this may annoy your customers.  Or, you may only be able to send full trucks once every two months.  To avoid these problems you can single source the customer and find the best single point of delivery to that customer.  That is, your products must all travel to single warehouse and then on to the customer.

It also becomes import to single source groups of customers.  For example, for simplicity, you may want to serve all the customers in Tennessee from a single warehouse to simplify your operations.  Or, you want to serve all your customers that are in the same Sunday Paper region so you can better manage promotions.  In the construction business, you want to make sure all the customers in a region receive product from the same manufacturing plant.  Boards and shingles coming from different plants can have slightly different colors.

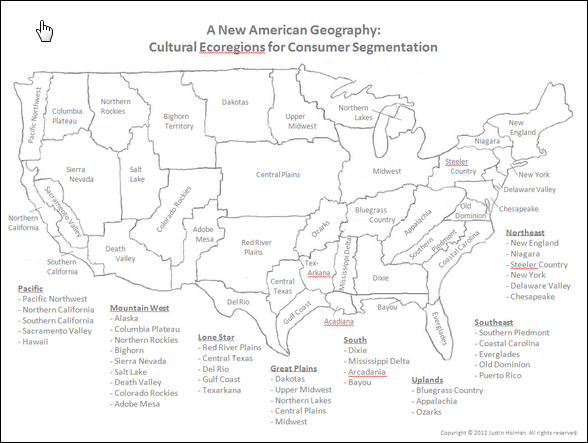
Justin Holman, CEO of TerraSeer, is doing some interesting work for the automotive aftermarket.  He put together the map you see in this post to help determine the similar regions for auto parts.  He has a post that explains the map and the fact the state boundaries are not helpful for forecasting auto parts.

If you apply his concept to network design, you might want to single the customers in each of the regions that Mr. Holman has identified.  This would simplify your decisions about what products to stock in each warehouse and would allow you to better manage demand.

Besides aftermarket auto parts, you could imagine that this analysis would apply to a wide range of products– construction materials, swimming pool products, sun screen, lawn care products, beverages, and about any other product whose demand changes by season.

Dual Sourcing Strategies and Network Design

Recently, I wrote about dual sourcing strategies in my SupplyChainDigest column.  The idea is that when firms try to decide if they should make a product in China or the U.S, they should also consider a dual sourcing strategy.

Professors Allon and Van Mieghem from Northwestern’s Kellogg School of Management have formalized this strategy in several papers and projects.

With this strategy, you can get the low cost benefit of China and the safety stock benefit of reacting to variability in the U.S.

But, there can be more to this strategy.  This discussion assumes that demand for this product is mostly in the U.S.  If demand for the product is world-wide, you need to use network design software to help determine where to make product for each market.  That is, do you make a product in each region of the world to avoid transportation costs or do you centralize production to take advantage of economies of scale.

The lessons we learned from dual sourcing still apply.  If it is better to make a product centrally because of economies of scale, then you may want to consider some local capability to handle the variability and reduce safety stock requirements.

This analysis is certainly more complex, but the extra effort can reduces costs and risks.

Visual Analytics in Network Design

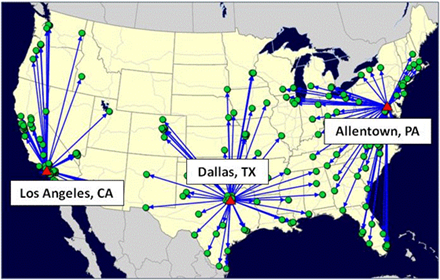
A professor from Rochester Institute of Technology pointed out that the visuals in network design can really help explain what the network looks like.  It is quite bland to just say that the solution picked

Los Angeles, Dallas, and Allentown.  By showing the solution with a map, you get a much better sense of what the solution actually means.

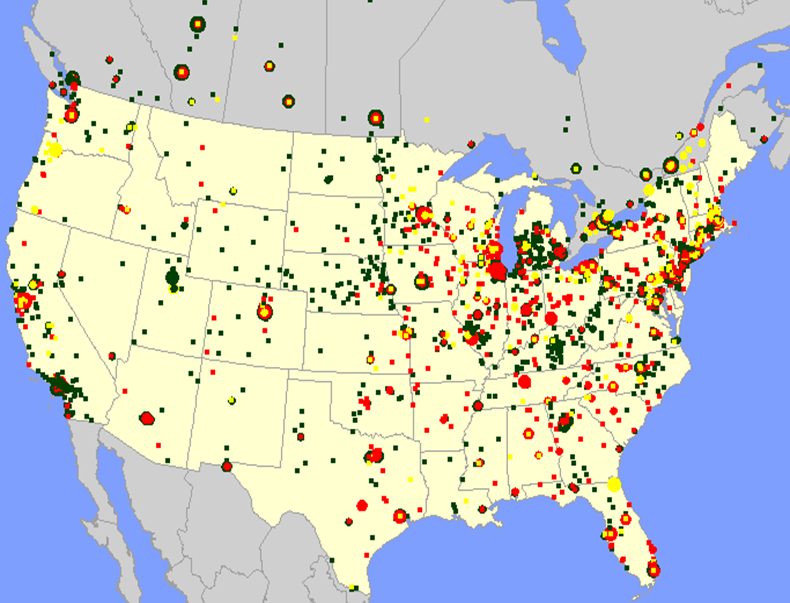
The same goes for the input.  You gain a lot of insight of into your customers by plotting them on a map, sizing them by relative demand, and coloring them by different characteristics.  See the map below for an example of this.  This visual analytics is very important for network design.  A supply chain is very complex. Showing the inputs and outputs using maps can help people understand what the model is doing.


Long Run Times, Part 2: How To Best Explain

When you hit the “run” button to solve a network design problem, you are starting a very hard mathematical optimization problem.  However, since machines keep getting faster and the optimization algorithms keep getting faster, you often see very reasonable run-times.

But, the underlying math is still a problem.  And, as Pete Cacioppi points out, it can be jarring for a user to make a small change in the problem and see the run times dramatically increase.

As Jean Francois Puget pointed out, the complaints about the long run times mean that people see the value and just want to solve larger problems.  I pointed to the Wikipedia article that shows that these problems are hard and to a long-standing offer of $1 million to anyone who can crack this code.

Still, these explanations don’t always help.  The person running the optimization is still baffled–  the model ran previously, but now doesn’t.  They don’t see a reason.

The problem is that the definition from Wikipedia and the contest seem to imply that the run times will always be terrible.  This is not the case.  Many times, the run times are quite good.

So, Jean Francois, Pete, and I exchanged a few emails to try to come up with a better way to explain what is going on.  With these problems, you can think of every different version of the problem (some with tweaks to the data or changes to the constraints).  Many of these versions will solve fine, and yet, some will not solve at all.  And, what Wikipedia’s article suggests is that there is no way to know in advance.

We came up with two explanations:

  • Solving these problems can be like navigating a mine field.  Sometimes you hit a version of the problem where the run time explodes.
  • Solving these problems is like golf.  Despite doing what you think is the same thing, this time you end up in the water, in the sand trap, or 20 strokes higher than your last game.

If you have better explanations, we would like to hear them.
Book Review of “Serious Play” and How it Relates to Network Design

Michael Schrage’s book, Serious Play:  How The World’s Best Companies Simulate to Innovate to Win, is worth a read as a general business book, but also very applicable to supply chain network design.

The book is about the prototypes an organization builds to help make decisions.  And, a network design model is a prototype of the supply chain.  So, many of the lessons apply directly to the supply chain team.  And, when you read the book, it makes you wonder why a company wouldn’t want a model of their supply chain.

One of his key insights breaks a myth that it is a good team that creates a good prototype. Instead, he argues that it is a good prototype that creates the good team and leads to discussion and insight.  He goes further to say that what is interesting about prototypes is not the model themselves, but what the models teach us about the organization.

Using a network design model as an example, he would ask questions like who gets to build the model, who gets to see the model, who gets to make suggestions, when do people get to see the model, do customers get to see the model, or do suppliers?  All these are good questions for a team building a supply chain model.

The book is full of different ideas you can apply to your modeling efforts.  Here are a few I pulled out:

  • “Waste as Thrift” (pg 100-101).  Once you have a model in place, it is relatively inexpensive to test ideas.  If you don’t “waste” scenarios, you are really risking wasting real money when you implement an idea without testing it.
  • “Bigger Isn’t Better (pg 131-137).  The object of the prototype or model isn’t to be as complex as reality.  Instead, the model needs to be understood by those who need to make decisions.
  • “The act of designing the model…is essential to understanding their use” (pg 168).  He argues that their is value in putting the model together.  We see this as well and think it is well worth your time to understand some of the underlying math.
  • It is important to create “conflict” with the model (pg 173).  The “conflict” is to set up the model to expose important trade-offs like cost versus service.  In network design, multi-objective optimization is great at bringing out those trade-offs.
  • “A prototype should be an invitation to play” (pg 208).  A great way to get value from a  model is to play with it try new things and see if you can come with some counter-intuitive solutions that change everyone’s thinking.

Long Run Times, Part 1: $1 Million to Make Them Faster

One of the problems that you can run into when doing a large network design project is the run times of the models.  Sometimes, the models you want to solve simply take much too long to solve or never solve at all.

Luckily, many network design problems do not encounter this problem.  And, good modeling techniques still allow you to get the answer you need to the most complex problems.

However, you will likely still need to explain to others on the project or in the organization why you can’t guarantee a fast run-time.  This question is relatively easy to answer, but our experience shows that people don’t believe the answer (we’ll share more on this in some future posts).

People don’t believe the answer because they’ve heard of cases of large models being solved quickly and they’ve models help give them answers to complex problems.

In any case, there is no guarantee that a network design model will run fast.  Roughly speaking, the field of computer science breaks these types of problems into two classes:  P and NP.  Problems in P can have guaranteed run times that scale in a linear fashion with the size of the problem.  Problems in NP do not scale linearly, but much much faster. So, a 10X increase in the size of the model may generate a 10000X increase in run time (pushing the run time into decades or more).

Network design problems fall into the class of NP problems.  If network design software vendors could guarantee run-times, they would.

As a fun fact about the difficulty of these problems, there has been a standing $1 Million prize (since May of 2000) for anyone who can show that NP problems can be solved like P.  So, if you can guarantee the run times of these problems, you can collect a $1 Million prize.