Fortune Magazine: Home Depot’s $300 Million Investment in DC’s and the Payoff

The latest Fortune magazine discusses the role that Home Depot’s CFO, Carol Tomé, played in their turnaround.  Their stock is up over 150% since the beginning of 2009, well ahead of Lowe’s.  The article credit’s her investment decisions.  And, the article gives a lot of credit to a project with a network design component:

Later, as other companies slashed outlays in response to the financial crisis, Tomé tacked in the opposite direction. During the dark days of early 2009, Home Depot embarked on an ambitious overhaul. It shed an inefficient process in which each store ordered products individually and spent $300 million to construct centralized distribution centers, which have saved time and money in ordering costs. “Home Depot readjusted the structure of the company, which allowed it to recover margin lost during the downturn and grow,” says Melich. The company’s operating profit margins, which fell from 11.5% in 2005 to 7.4% in 2008, have rebounded to 10.5% without a significant recovery in home-improvement demand or the housing market.

Of course, the network modeling was only part of this project.  But, when you are investing $300 million in new distributions centers, you want to make sure they are in the right place, they are the right size, and the right products flow through them– this is where network design comes in.
And, from the article, you can get a sense of the pay-off from overall projects like this– profit margins up to 10.5% from a low of 7.4% without a significant recovery in demand.

Same Day Delivery and Network Design

Same-day home delivery is getting a lot of attention in the press.  The stakes are high.  Amazon is trying to cut further into the market share of the brick-and-mortar retailers with delivery on the same day.  The brick-and-mortar retailers are fighting back, trying to use  their existing stores to deliver internet orders to the home the same day.

SupplyChain Digest ran an article called “Here Come the (Same Day) Delivery Wars.”  In their article they talk about programs from Amazon, Walmart, eBay, and the US Postal Service.  This is not just about the retailers.  Delivery companies are figuring out how they can profit from this as well.

The Wall Street Journal ran an article focusing on the battle between Walmart and Amazon.  In their article, they pointed out that Walmart can take advantage of their existing stores and deliver from there.  However, there is a high cost to pick a customer order from a store.  And, Walmart is creating some interesting twists to the business model– they think there are customers who want to order on-line, but want to pay in cash and would rather pick-up at the store.

Network design plays a large role in home delivery.  That is, you need to make sure you have facilities located close to customers so you can make the same day delivery.

But, network design is just part of the equation.  We saw a lot of e-commerce firms promise same day delivery before the dot-com bubble burst in 2001 and these firms couldn’t come close to making a profit with same day delivery.  Ten years later, will better IT systems and better use of existing infrastructure make this work?  I’m not sure.  I don’t know the economics of the pizza delivery market, but they seem to make it work.  Maybe other retailers will make it work this time.

Book Review from Supply Chain Digest

Dan Gilmore of Supply Chain Digest reviewed our book, Supply Chain Network Design.   Here is a small part of it:

“The book has a little bit of a textbook feel to it, and I am sure was designed in part for college course work, but the important point is there are a lot of us who could benefit from such an education. Why? Because we are often using network design tools on either a consistent or occasional basis, and don’t really understand what is going on inside that black box. Just as important, where all these tools can be applied, and (critically) the level of granularity of the data used in the model is usually not well understood by supply chain practitioners, who largely rely on consultants for that insight.


This book will empower practitioners to much better understand and drive some of that thinking themselves…”

Efficient Frontier

Business problems do not usually have a single correct solution.  Instead, someone has to make a tough trade-offs.

But, how do you know you fully understand the trade-offs?  That is, how can you be sure that there isn’t a better solution than the one you considering?

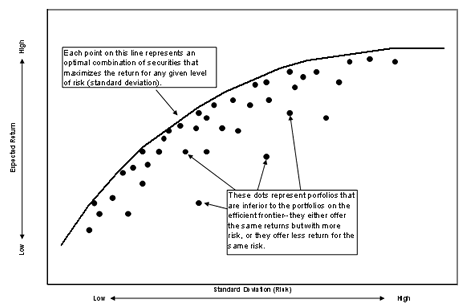
Determining the efficient frontier– a tool originally developed for finance and now applied to many business problems, will help you.  In finance, the efficient frontier is the curve of all investments that maximize return for a given level of risk (standard deviation).  The graph below (from InvestingAnswers) shows the curve and points that are not on the curve.  So, for any point not on the curve, you could find either an investment with a better return with the same risk or an investment with the same return and a much lower risk.  You still have to make the tough decision between return and risk, but the curve narrows your choices to  the best solutions.


In network design, you face similar trade-offs between cost and service levels, between capital invested and operating costs, and many more.  To better analyze these trade-offs, you need to create this efficient frontier.  Multi-objective optimization builds this trade-off curve for you.

ITW’s use of the 80/20 Rule

Illinois Tool Works (ITW) is a $17B organization with over 800 different operating units.  One of their guiding principles is the 80/20 Rule.  Here is their description:

“A driving force behind much of our success at ITW is our 80/20 business process, a practice that keeps us focused on our most profitable products and customers. The concept underlying 80/20 is simple: 80 percent of a company’s sales are derived from the 20 percent of its product offering being sold to key customers.


Put simply, too often companies do not spend enough time on the critical 20 percent of their key customers and products and spend too much time on the lower volume 80 percent…”

Earlier this year, we had a chance to speak with ITW at SCOPE.  Interestingly, you can apply the 80/20 to your network design models as well.  We spend a lot of time in the book talking about how to aggregate your customers and products.  ITW’s 80/20 rule suggests another way build models– only build models that include the 20% of the customers or products that drive 80% of the business.  This simplifies your model and gets you focused on the most important parts of your business.  (If you are skeptical, you can always build two versions of the model– one with the most important 20% of your customers and one with all of the customers– and see if they give different answers).

Visual Analytics in Network Design

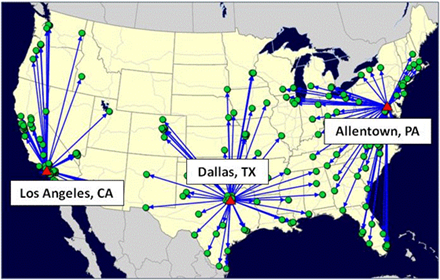
A professor from Rochester Institute of Technology pointed out that the visuals in network design can really help explain what the network looks like.  It is quite bland to just say that the solution picked

Los Angeles, Dallas, and Allentown.  By showing the solution with a map, you get a much better sense of what the solution actually means.

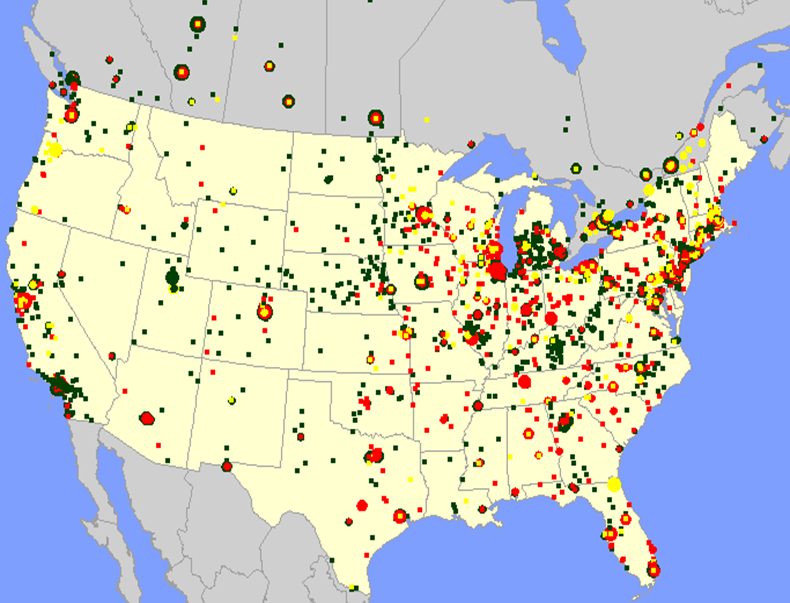
The same goes for the input.  You gain a lot of insight of into your customers by plotting them on a map, sizing them by relative demand, and coloring them by different characteristics.  See the map below for an example of this.  This visual analytics is very important for network design.  A supply chain is very complex. Showing the inputs and outputs using maps can help people understand what the model is doing.


Long Run Times, Part 2: How To Best Explain

When you hit the “run” button to solve a network design problem, you are starting a very hard mathematical optimization problem.  However, since machines keep getting faster and the optimization algorithms keep getting faster, you often see very reasonable run-times.

But, the underlying math is still a problem.  And, as Pete Cacioppi points out, it can be jarring for a user to make a small change in the problem and see the run times dramatically increase.

As Jean Francois Puget pointed out, the complaints about the long run times mean that people see the value and just want to solve larger problems.  I pointed to the Wikipedia article that shows that these problems are hard and to a long-standing offer of $1 million to anyone who can crack this code.

Still, these explanations don’t always help.  The person running the optimization is still baffled–  the model ran previously, but now doesn’t.  They don’t see a reason.

The problem is that the definition from Wikipedia and the contest seem to imply that the run times will always be terrible.  This is not the case.  Many times, the run times are quite good.

So, Jean Francois, Pete, and I exchanged a few emails to try to come up with a better way to explain what is going on.  With these problems, you can think of every different version of the problem (some with tweaks to the data or changes to the constraints).  Many of these versions will solve fine, and yet, some will not solve at all.  And, what Wikipedia’s article suggests is that there is no way to know in advance.

We came up with two explanations:

  • Solving these problems can be like navigating a mine field.  Sometimes you hit a version of the problem where the run time explodes.
  • Solving these problems is like golf.  Despite doing what you think is the same thing, this time you end up in the water, in the sand trap, or 20 strokes higher than your last game.

If you have better explanations, we would like to hear them.

Will Natural Gas Trucks Change Your Supply Chain?

Unfortunately, I missed CSCMP this year.  But, Dan Gilmore of SCDigest recorded an interview with T. Boone Pickens on the future of Natural Gas Trucks.

With the low price of natural gas, it is no wonder the supply chain community is starting to look at replacing diesel powered trucks with trucks running on natural gas.

The interview states that the the cost of a gallon of Liquefied Natural Gas (LNG) is about $2.80 compared to about $4.50 for diesel.  I don’t know if both types of vehicles get the same miles per gallon and have the same capacity, but assuming they are comparable, this is a significant drop in the cost per mile.

With a much lower cost per mile, this means that transportation becomes less expensive relative to warehouses and inventory and the difference between truck and rail decreases. Both of these trends should push you to need fewer warehouses.

In the short-term, without a network of fueling stations, it may also mean you design your network so that you can take advantage of natural gas by locating warehouses where you can access LNG.

In any case, this is just one more reason for staying on top of the design of your supply chain.

How Can You Use a Map that is a 1:1 Scale?

The art of modeling is to create a model that reflects reality, but is not as complex as reality.  You want to a model you can work with and analyze to help make decisions about the real world.

In network design, a big part of simplifying your model is aggregating your customers and products.  You have thousands of unique customers (or unique ship-to locations) and you typically group these by geography.  Likewise, you group your thousands of products into a few product families.

If you seen a successful project, you know that the aggregation of customers and products does not impact the quality of the results.

We have found that it can be difficult to explain why you need to aggregate at all.  In our book, we list reasons you need to aggregate and even reasons why an aggregate model can be more accurate than a detailed model.

But, sometimes all these answers do not help you convince others.  And, if you can’t convince key people that aggregation is valid, they may reject your entire model.  So, it never hurts to have different ways to explain why you need to aggregate.

The book, Serious Play, offers a another nice reason.  Ask yourself:  how could you use a map of city that was on a 1:1 scale?  That is, how could you use a map that was as big as the city? You couldn’t use a map this big.

That is why maps are not an a 1:1 scale and it is the same reason models are not as complex as the supply chain it is modeling.

Models are like maps for the supply chain.  They can’t be as “big” (or complex) as the real supply chain.  If they were, they would not do you any good.  A real map of the city leaves out a lot of detail, but is still very accurate for making good decisions.  This is what we are doing with a network design model.  It leaves out a lot of detail, but it is still accurate enough for good decisions.