Cost-To-Serve Modeling and Network Design

Earlier this week, I published an article on cost-to-serve on SupplyChainDigest.

Network design plays a nice role in cost-to-serve modeling:

Network design modeling software can complete the analysis by allocating those cost that simply cannot be allocated with Excel.  For example, it is not trivial to allocate your inbound transportation costs or costs of raw materials to your customers.  When using your network modeling software for this, you may want to model every customer and every product, but limit the amount of optimization (you don’t want to consider opening and closing facilities with this use of the tool.).  Then, when you run, the tool returns details on the cost to get each product to each customer.  In effect, this tool allocates all your transportation costs, your production costs, and your warehousing costs to a customer and product combination.  You get all this information as part of a standard network optimization run—it requires no special features.

This is another good reason to have the capability to run a network modeling tool.
Plant Location in a Global Economy

The Economist recently published an survey on Offshoring and Outsourcing.  If you follow manufacturing trends, this article is great read.

The survey covers trends in both manufacturing and services.  It goes in-depth into the manufacturing trend we are now seeing with many companies bringing manufacturing back to the US or to the market where the demand is.

The survey highlights the fact that companies are discovering the “all the disadvantages of distance.”  This includes the high transportation costs along with the extra risks.  But, it also points out that the wage gap is shrinking between China and the US, natural gas is driving down energy costs, and automation is removing a lot of labor anyway.

The article quotes one consultant who claims that if total labor costs are less than 15% of the product’s cost, then it is not worth it to pursue cheap labor.

Also, there was a nice quote that reminds us of the value and limitations of network design:

Choosing the right location for producing a good or a service is an inexact science, and many companies got it wrong.

They are correct, that network design is not an exact science, but using network design tools can help you better narrow your choices and pick good solutions.  With network design, you have a better chance of getting it right.  And, if you continually model your supply chain, you can better adjust as conditions change.

Some Basics of Modeling Multiple Time Periods

Adding extra time periods to a network design model turns out to be a bit harder than it would seem.

First, since network design is a computationally hard problem, when we create a 12 time period model, the size grows by 12X, but run time could easily increase by 100X.  So, keep that in mind as you add multiple time periods.

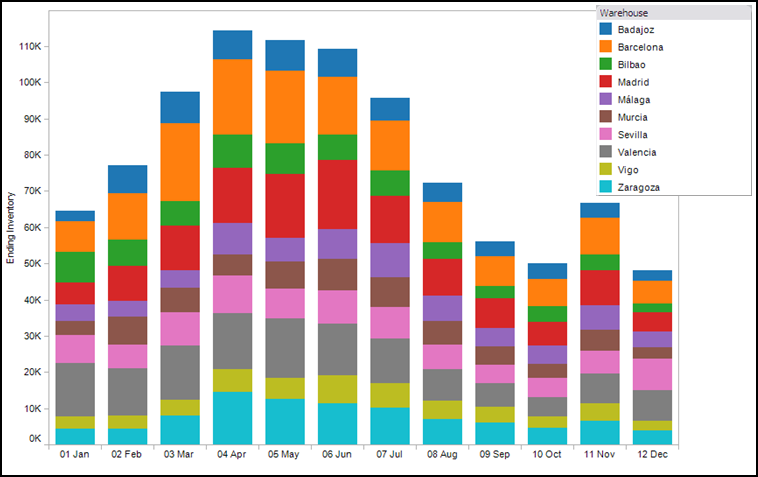
Second, you need to think harder about how the model works.  One key idea is to think about what links the time periods together.  In a model with multiple years (say an annual model for the next 10 years), the locations link one time period to the next.  That is, if you open a new plant in Year 2, it will be there in Year 3 unless you close it.  In a model with multiple weeks or months, the locations still link the time periods.  But, inventory also links the time periods.  So, I can build extra inventory in March that will be used to satisfy demand in July (the graph at the top is showing this inventory build).

Finally, you need to think about the data.  There is nothing unique about a multi-year model.  But, with a monthly model, you need to think about the starting inventory (there is product in the system at time period 0) and the ending inventory (you don’t want the model to drain all the inventory from the system in the last time periods).  Collecting data on starting and ending inventory can be problematic.  If you can do it, it is sometimes helpful to start your model at the very end of the season when inventory is at its lowest.  This can prevent some of the data issues.

Top 5 Models You Should Build in 2013

On SCDigest, I wrote an article about the 5 models you should build in 2013.  These are simple models meant to get you started and add value.  Here is the list, but see the SCDigest article for more detail.

#1.  Plot your demand on a map

#2.  Add the current lanes you are using to serve your customers

#3.  Reassign customer territories

#4.  Model what would happen if you lost a warehouse

#5.  Model a single product

Using Tableau Public for Sample Customer Analysis

Tableau has an offering called Tableau Public that allows you to easily publish your reports to the web.  As a corporate user, you should note that the data you publish is publicly available- so you will want to be careful what you publish).

For those who don’t know, Tableau is powerful and flexible reporting engine.  We have found it very helpful for understanding your supply chain.  One of our clients, Armstrong World Industries reported that this reporting allowed the modeler to sit down with the business user and answer questions about the supply chain on the spot.

Below is a quick example of the type of reports you can generate.  I loaded customer level data showing the time in transit from the warehouse in Chicago, the total demand, and the demand broken down by mode (rail or truck) and by product (A, B, or C).  The first tab you see below shows the each of the customers, sized by demand, and colored by the transit time from the Chicago warehouse.  You can get a lot of information from your supply chain with a map.  (The map below should be interactive so you can play around with it on your own).