Some Basics of Modeling Multiple Time Periods

Adding extra time periods to a network design model turns out to be a bit harder than it would seem.

First, since network design is a computationally hard problem, when we create a 12 time period model, the size grows by 12X, but run time could easily increase by 100X.  So, keep that in mind as you add multiple time periods.

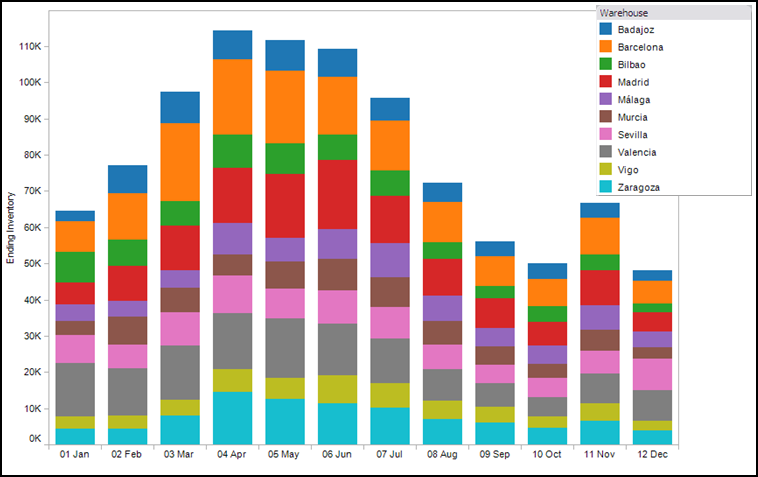
Second, you need to think harder about how the model works.  One key idea is to think about what links the time periods together.  In a model with multiple years (say an annual model for the next 10 years), the locations link one time period to the next.  That is, if you open a new plant in Year 2, it will be there in Year 3 unless you close it.  In a model with multiple weeks or months, the locations still link the time periods.  But, inventory also links the time periods.  So, I can build extra inventory in March that will be used to satisfy demand in July (the graph at the top is showing this inventory build).

Finally, you need to think about the data.  There is nothing unique about a multi-year model.  But, with a monthly model, you need to think about the starting inventory (there is product in the system at time period 0) and the ending inventory (you don’t want the model to drain all the inventory from the system in the last time periods).  Collecting data on starting and ending inventory can be problematic.  If you can do it, it is sometimes helpful to start your model at the very end of the season when inventory is at its lowest.  This can prevent some of the data issues.
Top 5 Models You Should Build in 2013

On SCDigest, I wrote an article about the 5 models you should build in 2013.  These are simple models meant to get you started and add value.  Here is the list, but see the SCDigest article for more detail.

#1.  Plot your demand on a map

#2.  Add the current lanes you are using to serve your customers

#3.  Reassign customer territories

#4.  Model what would happen if you lost a warehouse

#5.  Model a single product

Using Tableau Public for Sample Customer Analysis

Tableau has an offering called Tableau Public that allows you to easily publish your reports to the web.  As a corporate user, you should note that the data you publish is publicly available- so you will want to be careful what you publish).

For those who don’t know, Tableau is powerful and flexible reporting engine.  We have found it very helpful for understanding your supply chain.  One of our clients, Armstrong World Industries reported that this reporting allowed the modeler to sit down with the business user and answer questions about the supply chain on the spot.

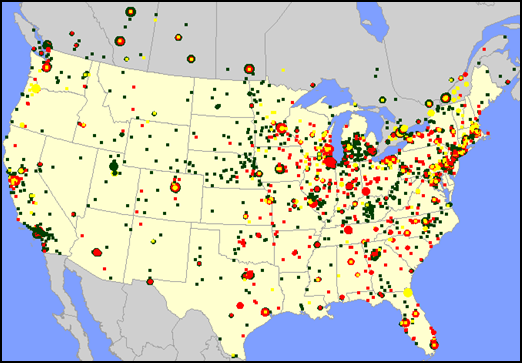
Below is a quick example of the type of reports you can generate.  I loaded customer level data showing the time in transit from the warehouse in Chicago, the total demand, and the demand broken down by mode (rail or truck) and by product (A, B, or C).  The first tab you see below shows the each of the customers, sized by demand, and colored by the transit time from the Chicago warehouse.  You can get a lot of information from your supply chain with a map.  (The map below should be interactive so you can play around with it on your own).

Start Your Big Data Journey with a Map

Justin Holman, the CEO of TerraSeer, recently wrote an interesting blog post suggesting that a great place to start a Big Data journey is to build a map.  He argued that most firms  and managers don’t have the resources or technical capability to do a full-blown analysis on all their data.  But, a map is a relatively simple place to start that will allow you to visualize a lot of data quickly and in a new way (most firms still don’t use enough maps to view data.)

For the supply chain manager, I would agree.  As we’ve discussed before, a map can be a great way to view your customers by different types and relative demand (as seen in the map above).  It can also be a great way to see how product is flowing through the supply chain.

We have seen many cases where a company finds savings opportunities by just looking at their data on a map.  It is often the first time the managers have seen the data presented in this way.  And, it allows the managers to quickly understand their business in ways that were not obvious before.

Even if you are not doing a full-blown network design study, I would still recommend mapping your customers and supply chain.  You may learn something new.

Importance of Single Sourcing Groups of Customers


In practice, you need flexibility to single source customers and groups of customers.  (By customers, I am referring to the final ship-to location.  This could be a retail store, your distributor’s warehouse, or even an end consumer)

For example, you many minimize your costs by shipping from multiple warehouses or plants to a customer.  But, this may annoy your customers.  Or, you may only be able to send full trucks once every two months.  To avoid these problems you can single source the customer and find the best single point of delivery to that customer.  That is, your products must all travel to single warehouse and then on to the customer.

It also becomes import to single source groups of customers.  For example, for simplicity, you may want to serve all the customers in Tennessee from a single warehouse to simplify your operations.  Or, you want to serve all your customers that are in the same Sunday Paper region so you can better manage promotions.  In the construction business, you want to make sure all the customers in a region receive product from the same manufacturing plant.  Boards and shingles coming from different plants can have slightly different colors.

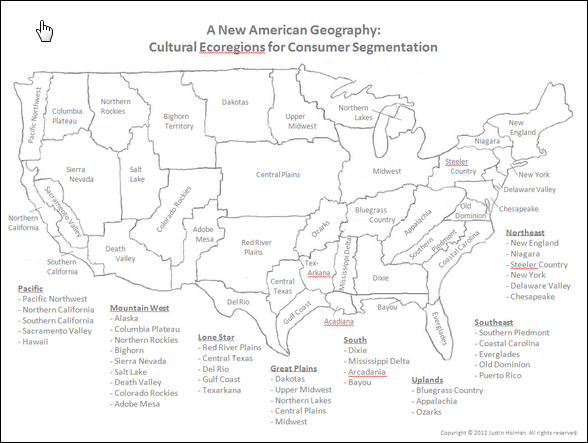
Justin Holman, CEO of TerraSeer, is doing some interesting work for the automotive aftermarket.  He put together the map you see in this post to help determine the similar regions for auto parts.  He has a post that explains the map and the fact the state boundaries are not helpful for forecasting auto parts.

If you apply his concept to network design, you might want to single the customers in each of the regions that Mr. Holman has identified.  This would simplify your decisions about what products to stock in each warehouse and would allow you to better manage demand.

Besides aftermarket auto parts, you could imagine that this analysis would apply to a wide range of products– construction materials, swimming pool products, sun screen, lawn care products, beverages, and about any other product whose demand changes by season.

Dual Sourcing Strategies and Network Design

Recently, I wrote about dual sourcing strategies in my SupplyChainDigest column.  The idea is that when firms try to decide if they should make a product in China or the U.S, they should also consider a dual sourcing strategy.

Professors Allon and Van Mieghem from Northwestern’s Kellogg School of Management have formalized this strategy in several papers and projects.

With this strategy, you can get the low cost benefit of China and the safety stock benefit of reacting to variability in the U.S.

But, there can be more to this strategy.  This discussion assumes that demand for this product is mostly in the U.S.  If demand for the product is world-wide, you need to use network design software to help determine where to make product for each market.  That is, do you make a product in each region of the world to avoid transportation costs or do you centralize production to take advantage of economies of scale.

The lessons we learned from dual sourcing still apply.  If it is better to make a product centrally because of economies of scale, then you may want to consider some local capability to handle the variability and reduce safety stock requirements.

This analysis is certainly more complex, but the extra effort can reduces costs and risks.

Network Design within a City for Same-Day Delivery

We typically think of network design at the national level.  However, the same principles apply when doing a study at a very local level.  For example, we’ve talked about the pizza delivery model as a good example.

This topic is becoming more important as retailers try to figure out same-day delivery.  I talk about his issue in  blog post at SupplyChainDigest.