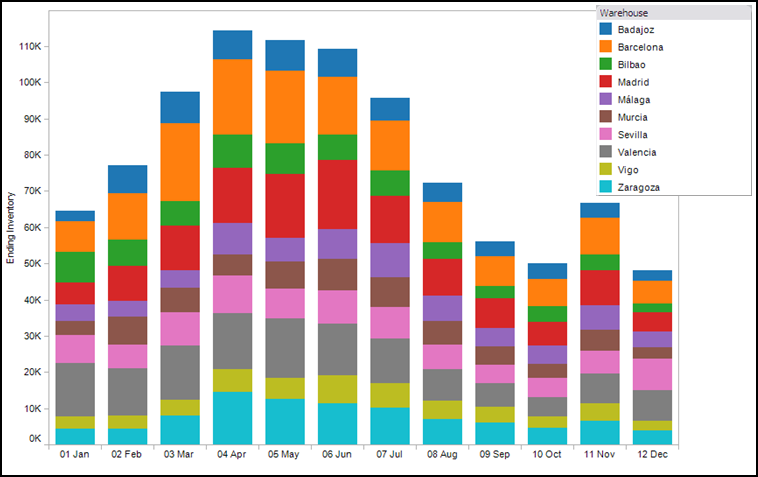
 Adding extra time periods to a network design model turns out to be a bit harder than it would seem.
First, since network design is a computationally hard problem, when we create a 12 time period model, the size grows by 12X, but run time could easily increase by 100X. So, keep that in mind as you add multiple time periods.
Second, you need to think harder about how the model works. One key idea is to think about what links the time periods together. In a model with multiple years (say an annual model for the next 10 years), the locations link one time period to the next. That is, if you open a new plant in Year 2, it will be there in Year 3 unless you close it. In a model with multiple weeks or months, the locations still link the time periods. But, inventory also links the time periods. So, I can build extra inventory in March that will be used to satisfy demand in July (the graph at the top is showing this inventory build).
Finally, you need to think about the data. There is nothing unique about a multi-year model. But, with a monthly model, you need to think about the starting inventory (there is product in the system at time period 0) and the ending inventory (you don’t want the model to drain all the inventory from the system in the last time periods). Collecting data on starting and ending inventory can be problematic. If you can do it, it is sometimes helpful to start your model at the very end of the season when inventory is at its lowest. This can prevent some of the data issues.