WSJ Article: Supply Chain Management is the Hot New MBA Topic

Today’s Wall Street Journal featured an article on the growing popularity of supply chain management in MBA and undergraduate programs.  Here is the opening of the article:

Call it a problem of supply and demand.

With global operations becoming more complex, companies in manufacturing, retail and technology—and the consulting firms that service them—are scrambling to hire people with supply-chain expertise. But these experts are hard to come by.

Sensing growing demand, more than a half-dozen universities have recently introduced undergraduate majors, M.B.A. concentrations and even entire degree programs dedicated to procurement, inventory management and global supply-chain strategy.

This again shows the continued importance of network design.  Bringing network design to the classroom can enhance the student’s learning.  I have had good success using IBM’s LogicNet Plus in the classroom at Northwestern.  And, the students seem to get a lot out of using a commercial tool.  If you are a professor teaching this topic, we have a lot of material to help get you started.  And, drop me a note if you would be interested in a more in-depth discussion.
Educational White Paper on Bi-Objective Optimzaiton

IBM just published an educational white paper by Pete Cacioppi on bi-objective optimization.

This white paper provides details for the interested business user as well as the researcher into the latest thinking in solving problems with more than one objective.

The paper discusses the business benefit of viewing the trade-off curve between two objectives and how this can give valuable insights into your problem.

It also explains some of the science behind this bi-objective optimization and how  massively parallel cloud computing can effectively solve these problems.

Bring Network Design To Your Classroom: Latest Trends and Commercial Software

On Thursday, April 18 at 12 PM ET, (11 CT, 10 MT, and 9 PT), we will be hosting a 30-minute webinar for professors interested in bringing network design into the classroom.

The topic can be a full class or part of a class in supply chain, operations, or optimization.

Network design continues to play an important role in the running of a supply chain. Future supply chain managers need to know about this topic. This webinar event will cover the latest trends in network design and tie these trends to case studies. Co-authors Sara Lewis and Michael Watson will also cover how you can bring free commercial network design software into your classroom to enhance your student’s learning and expose them to real-world sized problems. Additionally, they will talk about how you can position network design into a variety of different classes. The 30-minute webinar will conclude with a Q&A session.


Registration Details
Date: Thursday, April 18, 2013, 12:00 pm, Eastern Daylight Time
Meeting Number: 840 023 266
Meeting Password: 0418

Click here for the webinar link (same as the link at the top of the post).

Mars Wrigley Presentation On Use of Network Design

IBM posted a YouTube Video of Mars and Wrigley discussing, “how they used IBM ILOG’s supply chain applications; LogicNet Plus XE, Inventory Analyst, and Transportation Analyst to maximize the efficiency of their global network for huge savings in a presentation to IBM Smarter Supply Chains Regional Symposium and Users’ Conference in 2009.”

Efficient Frontier

Business problems do not usually have a single correct solution.  Instead, someone has to make a tough trade-offs.

But, how do you know you fully understand the trade-offs?  That is, how can you be sure that there isn’t a better solution than the one you considering?

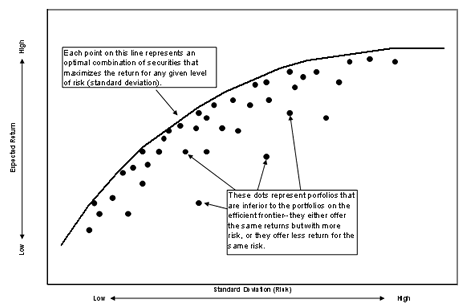
Determining the efficient frontier– a tool originally developed for finance and now applied to many business problems, will help you.  In finance, the efficient frontier is the curve of all investments that maximize return for a given level of risk (standard deviation).  The graph below (from InvestingAnswers) shows the curve and points that are not on the curve.  So, for any point not on the curve, you could find either an investment with a better return with the same risk or an investment with the same return and a much lower risk.  You still have to make the tough decision between return and risk, but the curve narrows your choices to  the best solutions.


In network design, you face similar trade-offs between cost and service levels, between capital invested and operating costs, and many more.  To better analyze these trade-offs, you need to create this efficient frontier.  Multi-objective optimization builds this trade-off curve for you.

ITW’s use of the 80/20 Rule

Illinois Tool Works (ITW) is a $17B organization with over 800 different operating units.  One of their guiding principles is the 80/20 Rule.  Here is their description:

“A driving force behind much of our success at ITW is our 80/20 business process, a practice that keeps us focused on our most profitable products and customers. The concept underlying 80/20 is simple: 80 percent of a company’s sales are derived from the 20 percent of its product offering being sold to key customers.


Put simply, too often companies do not spend enough time on the critical 20 percent of their key customers and products and spend too much time on the lower volume 80 percent…”

Earlier this year, we had a chance to speak with ITW at SCOPE.  Interestingly, you can apply the 80/20 to your network design models as well.  We spend a lot of time in the book talking about how to aggregate your customers and products.  ITW’s 80/20 rule suggests another way build models– only build models that include the 20% of the customers or products that drive 80% of the business.  This simplifies your model and gets you focused on the most important parts of your business.  (If you are skeptical, you can always build two versions of the model– one with the most important 20% of your customers and one with all of the customers– and see if they give different answers).

Visual Analytics in Network Design

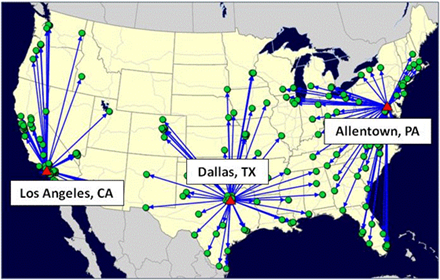
A professor from Rochester Institute of Technology pointed out that the visuals in network design can really help explain what the network looks like.  It is quite bland to just say that the solution picked

Los Angeles, Dallas, and Allentown.  By showing the solution with a map, you get a much better sense of what the solution actually means.

The same goes for the input.  You gain a lot of insight of into your customers by plotting them on a map, sizing them by relative demand, and coloring them by different characteristics.  See the map below for an example of this.  This visual analytics is very important for network design.  A supply chain is very complex. Showing the inputs and outputs using maps can help people understand what the model is doing.


Long Run Times, Part 2: How To Best Explain

When you hit the “run” button to solve a network design problem, you are starting a very hard mathematical optimization problem.  However, since machines keep getting faster and the optimization algorithms keep getting faster, you often see very reasonable run-times.

But, the underlying math is still a problem.  And, as Pete Cacioppi points out, it can be jarring for a user to make a small change in the problem and see the run times dramatically increase.

As Jean Francois Puget pointed out, the complaints about the long run times mean that people see the value and just want to solve larger problems.  I pointed to the Wikipedia article that shows that these problems are hard and to a long-standing offer of $1 million to anyone who can crack this code.

Still, these explanations don’t always help.  The person running the optimization is still baffled–  the model ran previously, but now doesn’t.  They don’t see a reason.

The problem is that the definition from Wikipedia and the contest seem to imply that the run times will always be terrible.  This is not the case.  Many times, the run times are quite good.

So, Jean Francois, Pete, and I exchanged a few emails to try to come up with a better way to explain what is going on.  With these problems, you can think of every different version of the problem (some with tweaks to the data or changes to the constraints).  Many of these versions will solve fine, and yet, some will not solve at all.  And, what Wikipedia’s article suggests is that there is no way to know in advance.

We came up with two explanations:

  • Solving these problems can be like navigating a mine field.  Sometimes you hit a version of the problem where the run time explodes.
  • Solving these problems is like golf.  Despite doing what you think is the same thing, this time you end up in the water, in the sand trap, or 20 strokes higher than your last game.

If you have better explanations, we would like to hear them.

Four More Topics You Can Teach with Network Design

After our post on nine topics you can cover with network design, some folks reminded us of a few more and we added to the list.

  1.  Project Management.  We cover project management in the context of network design.  But, if you wanted to cover it in more detail, you could use this as a launching point
  2. Net Present Value (NPV) or Return-on-Investment or Financial Analysis.  We have an exercise on calculating the NPV for an investment in new facilities.  Future suppl chain leaders will need to know how to do financial analysis.  Justifying the opening and closing of facilities is a big one.  But, many others things will have to investigated.  For example, should you add racks to your warehouse, should you invest in your fleet, should you buy more fork trucks, or should you replace aging equipment?
  3. Microsoft Access, Excel Pivot Tables, and Tableau.   Network design gives you a chance to teach students how to deal with large data sets.  This includes just working with the data as well as reporting on it.  An import skill is to be able summarize large data sets.
  4. Change management and Organizational Behavior.  When you make major changes in the supply chain, it personally impacts a lot of different people.  It is important to understand how different people may react to the change and how to manage this change in an organization.

If you think of new ones, please let us know.


Long Run Times, Part 1: $1 Million to Make Them Faster

One of the problems that you can run into when doing a large network design project is the run times of the models.  Sometimes, the models you want to solve simply take much too long to solve or never solve at all.

Luckily, many network design problems do not encounter this problem.  And, good modeling techniques still allow you to get the answer you need to the most complex problems.

However, you will likely still need to explain to others on the project or in the organization why you can’t guarantee a fast run-time.  This question is relatively easy to answer, but our experience shows that people don’t believe the answer (we’ll share more on this in some future posts).

People don’t believe the answer because they’ve heard of cases of large models being solved quickly and they’ve models help give them answers to complex problems.

In any case, there is no guarantee that a network design model will run fast.  Roughly speaking, the field of computer science breaks these types of problems into two classes:  P and NP.  Problems in P can have guaranteed run times that scale in a linear fashion with the size of the problem.  Problems in NP do not scale linearly, but much much faster. So, a 10X increase in the size of the model may generate a 10000X increase in run time (pushing the run time into decades or more).

Network design problems fall into the class of NP problems.  If network design software vendors could guarantee run-times, they would.

As a fun fact about the difficulty of these problems, there has been a standing $1 Million prize (since May of 2000) for anyone who can show that NP problems can be solved like P.  So, if you can guarantee the run times of these problems, you can collect a $1 Million prize.